 josh white
The Growth Engine · software
One live view of your growth, cash and plan
The Growth Engine is a company dashboard. It reads your real systems every day, does the math itself, and shows you what happened, what's likely next, and what it means for cash.
book a free 30-minute call →Josh White, Fractional COO
reads
Your sales and marketing channels, tied to your accounting software. Read-only.
forecasts
Bear, Base and Bull scenarios, plus 13 weeks of cash.
keeps score
Forecast vs actual, every month, against a frozen plan.
Where it came from
The Growth Engine is the core of what I share with my fractional clients: one dashboard that connects your accounting software with your sales and performance marketing channels, so you get a full cross-functional view of the business.
I built and refined it over five years with my fractional clients, in Google Sheets. It's now its own app. You view it. Your AI Co-Pilot and I keep it current.
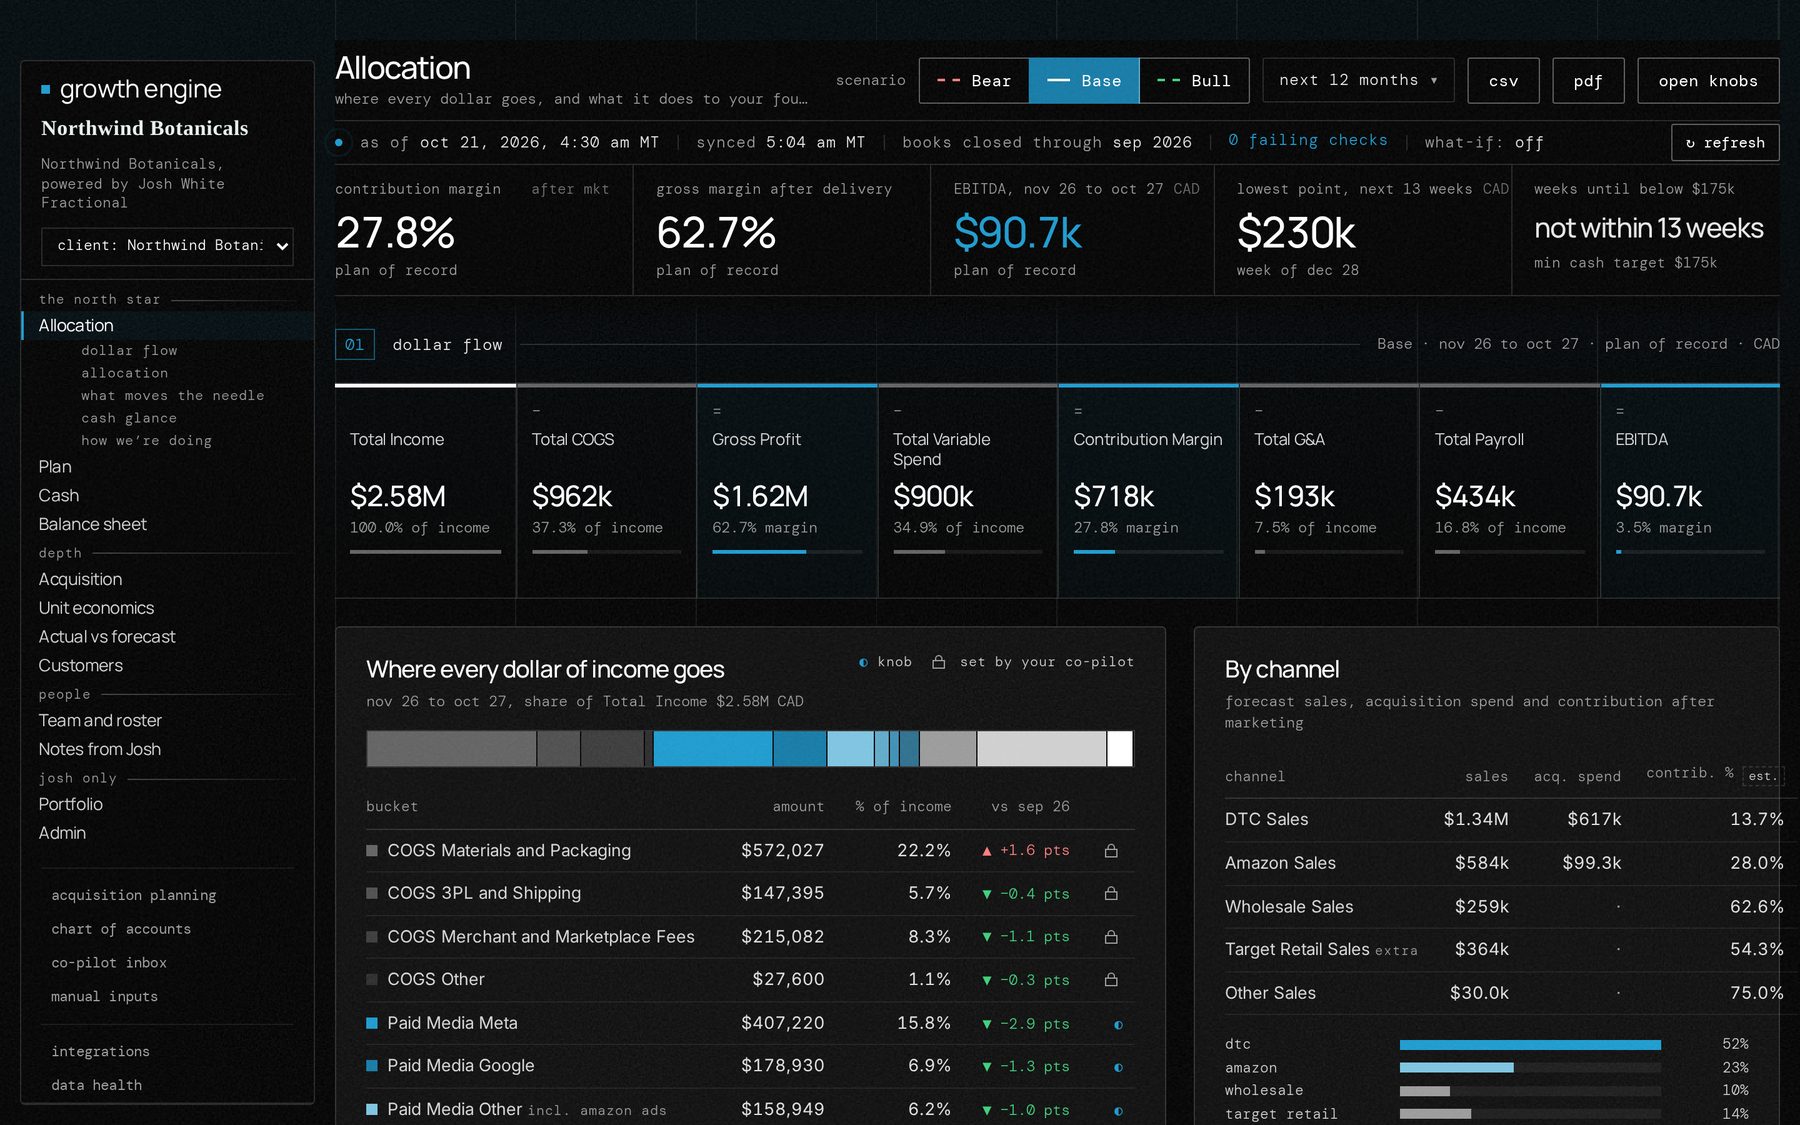
The home screen
Inside the dashboard
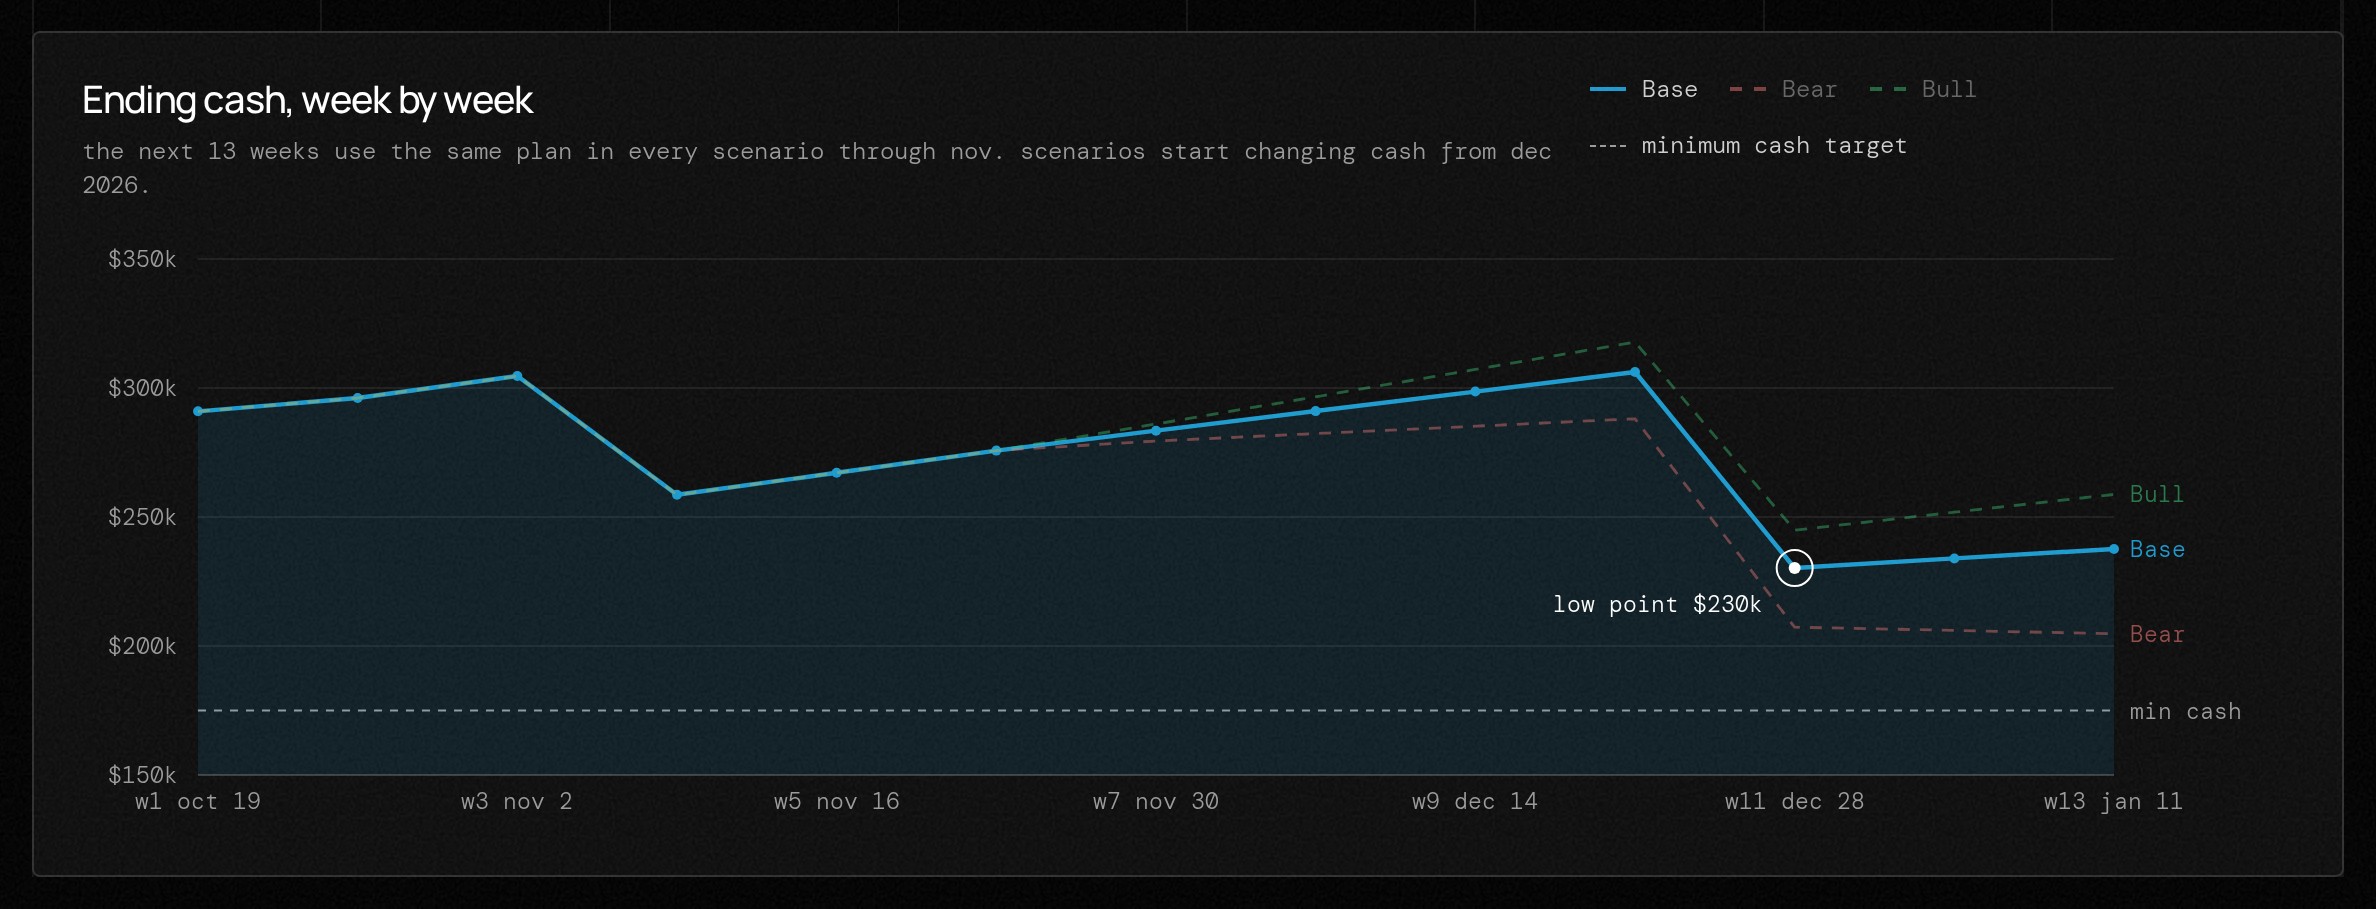
13-week cash
Do we run low, when, and why.
Ending cash week by week for the next thirteen weeks, with Bear, Base and Bull lines and your minimum cash target. The ring marks the low point. Use it to time a PO, more ad spend or a hire so you don't land in the low week.
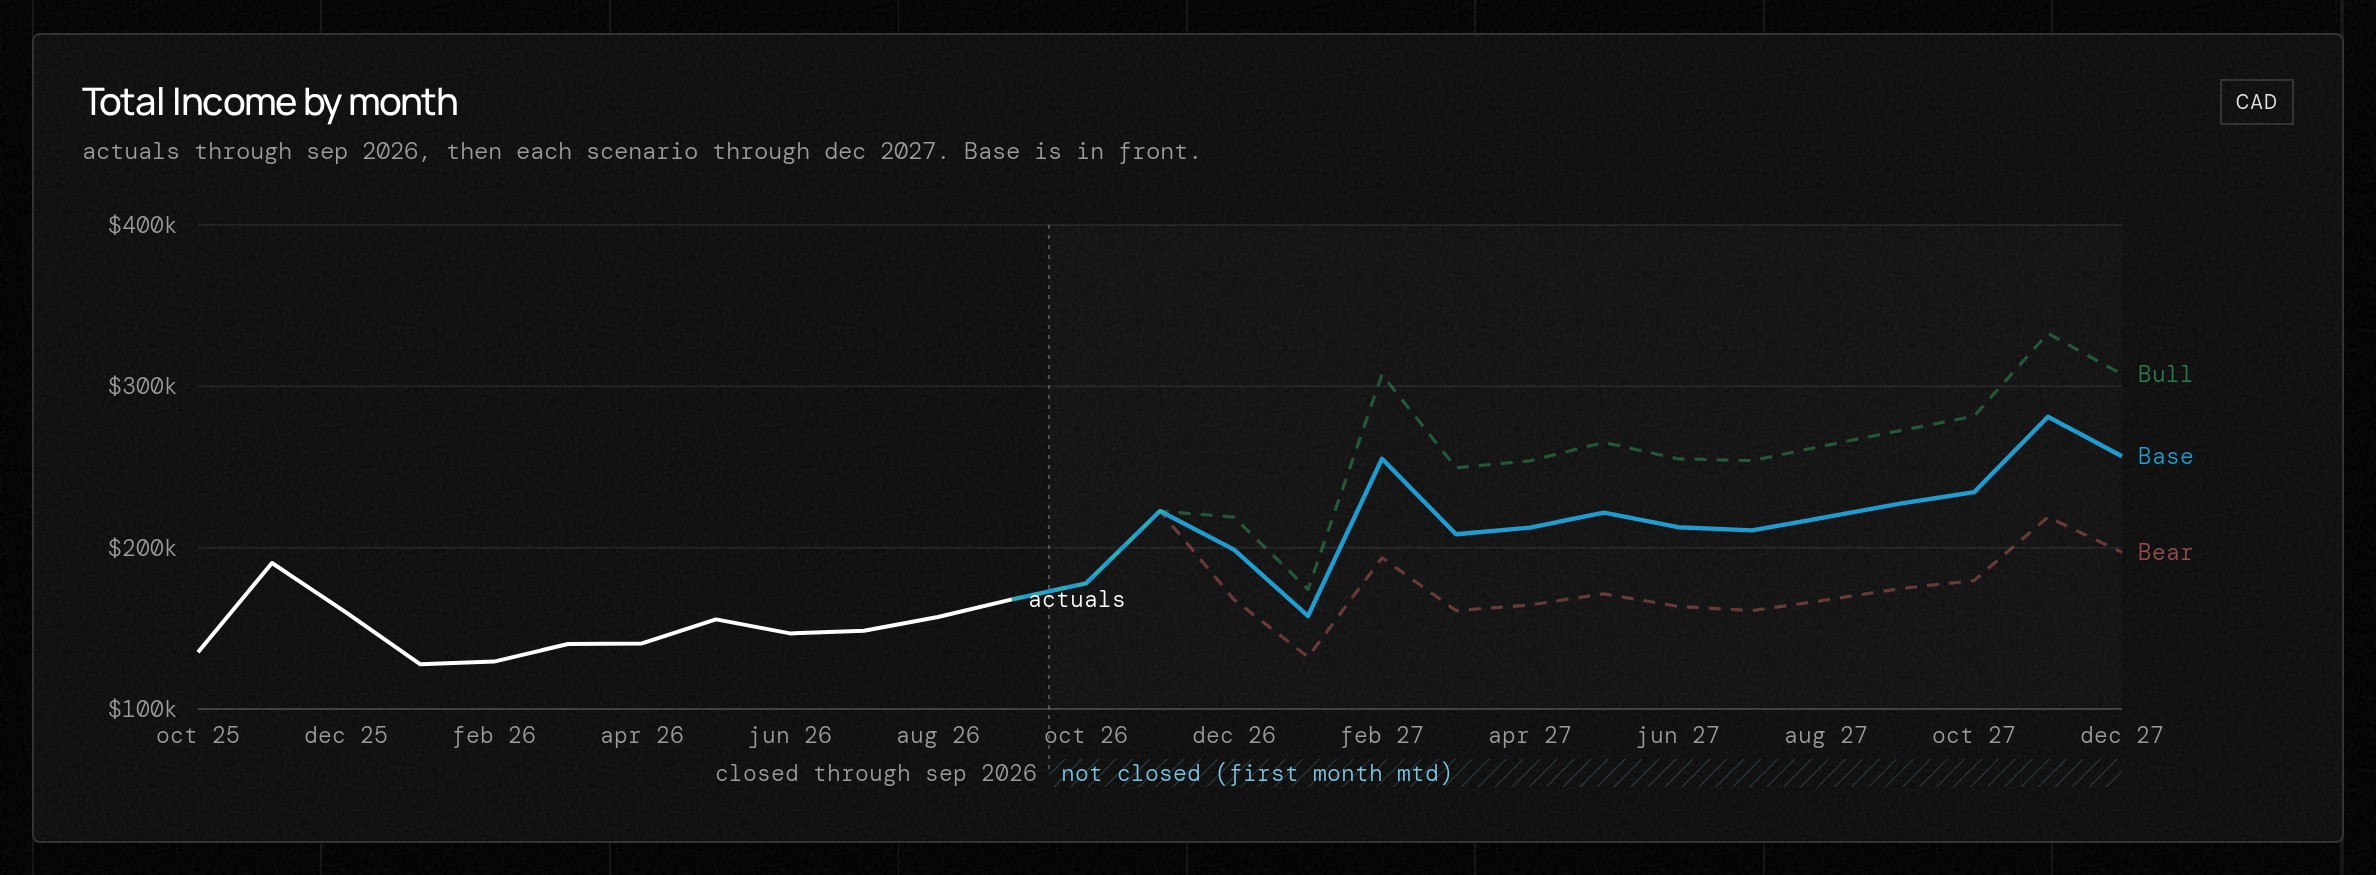
Plan and scenarios
Where income lands in Bear, Base and Bull.
Actuals through the last closed month, then each scenario month by month. Base is the plan we run the business on. Use it to decide how big a commitment you can make and still be fine in Bear.
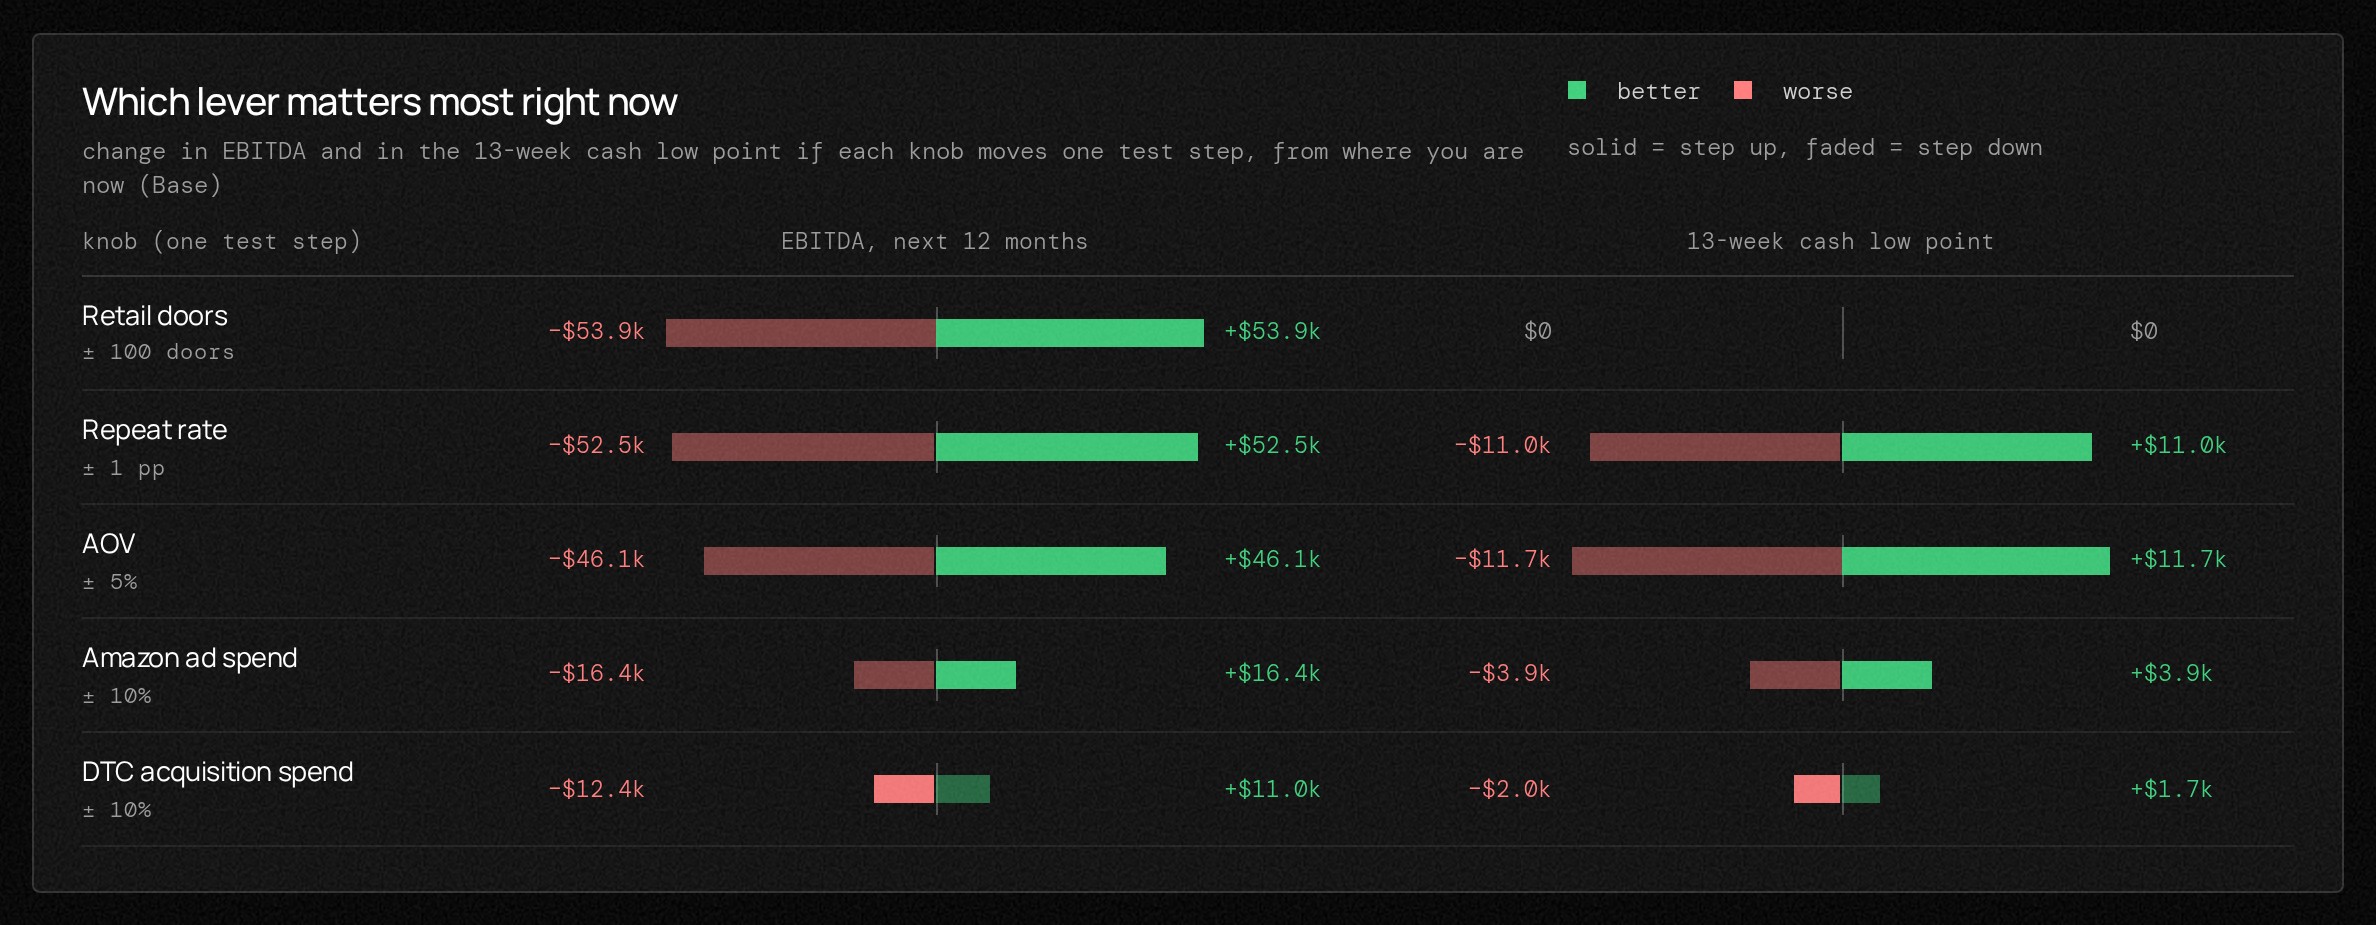
What moves the needle
Which lever matters most right now.
Each lever (retail doors, repeat rate, order value, marketplace ad spend, DTC acquisition spend) moved a step up and a step down, and what that does to EBITDA and the 13-week cash low point. Use it to pick where to spend your attention first.
Why cash moves
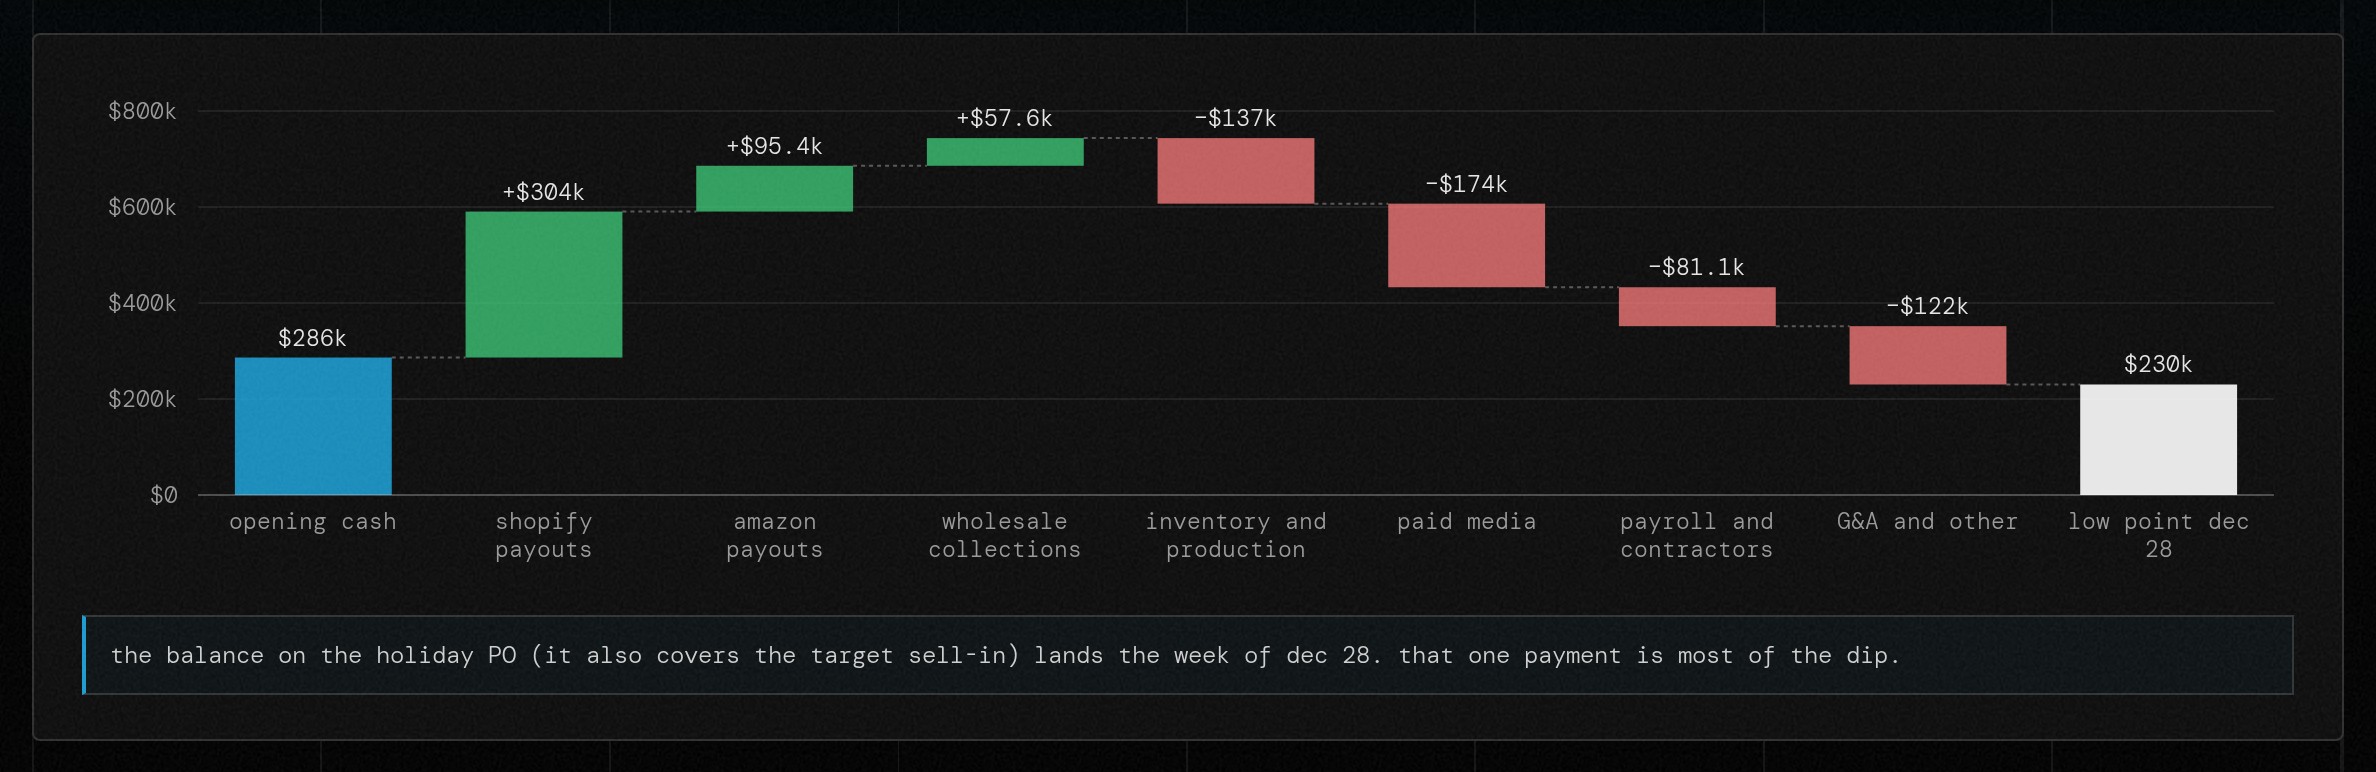
What fills the account and what drains it.
A bridge from opening cash to the low point: store and marketplace payouts and wholesale collections in, then inventory, paid media, payroll and overhead out. Use it to see which outflow to move when the low week gets tight.
Spend response curve
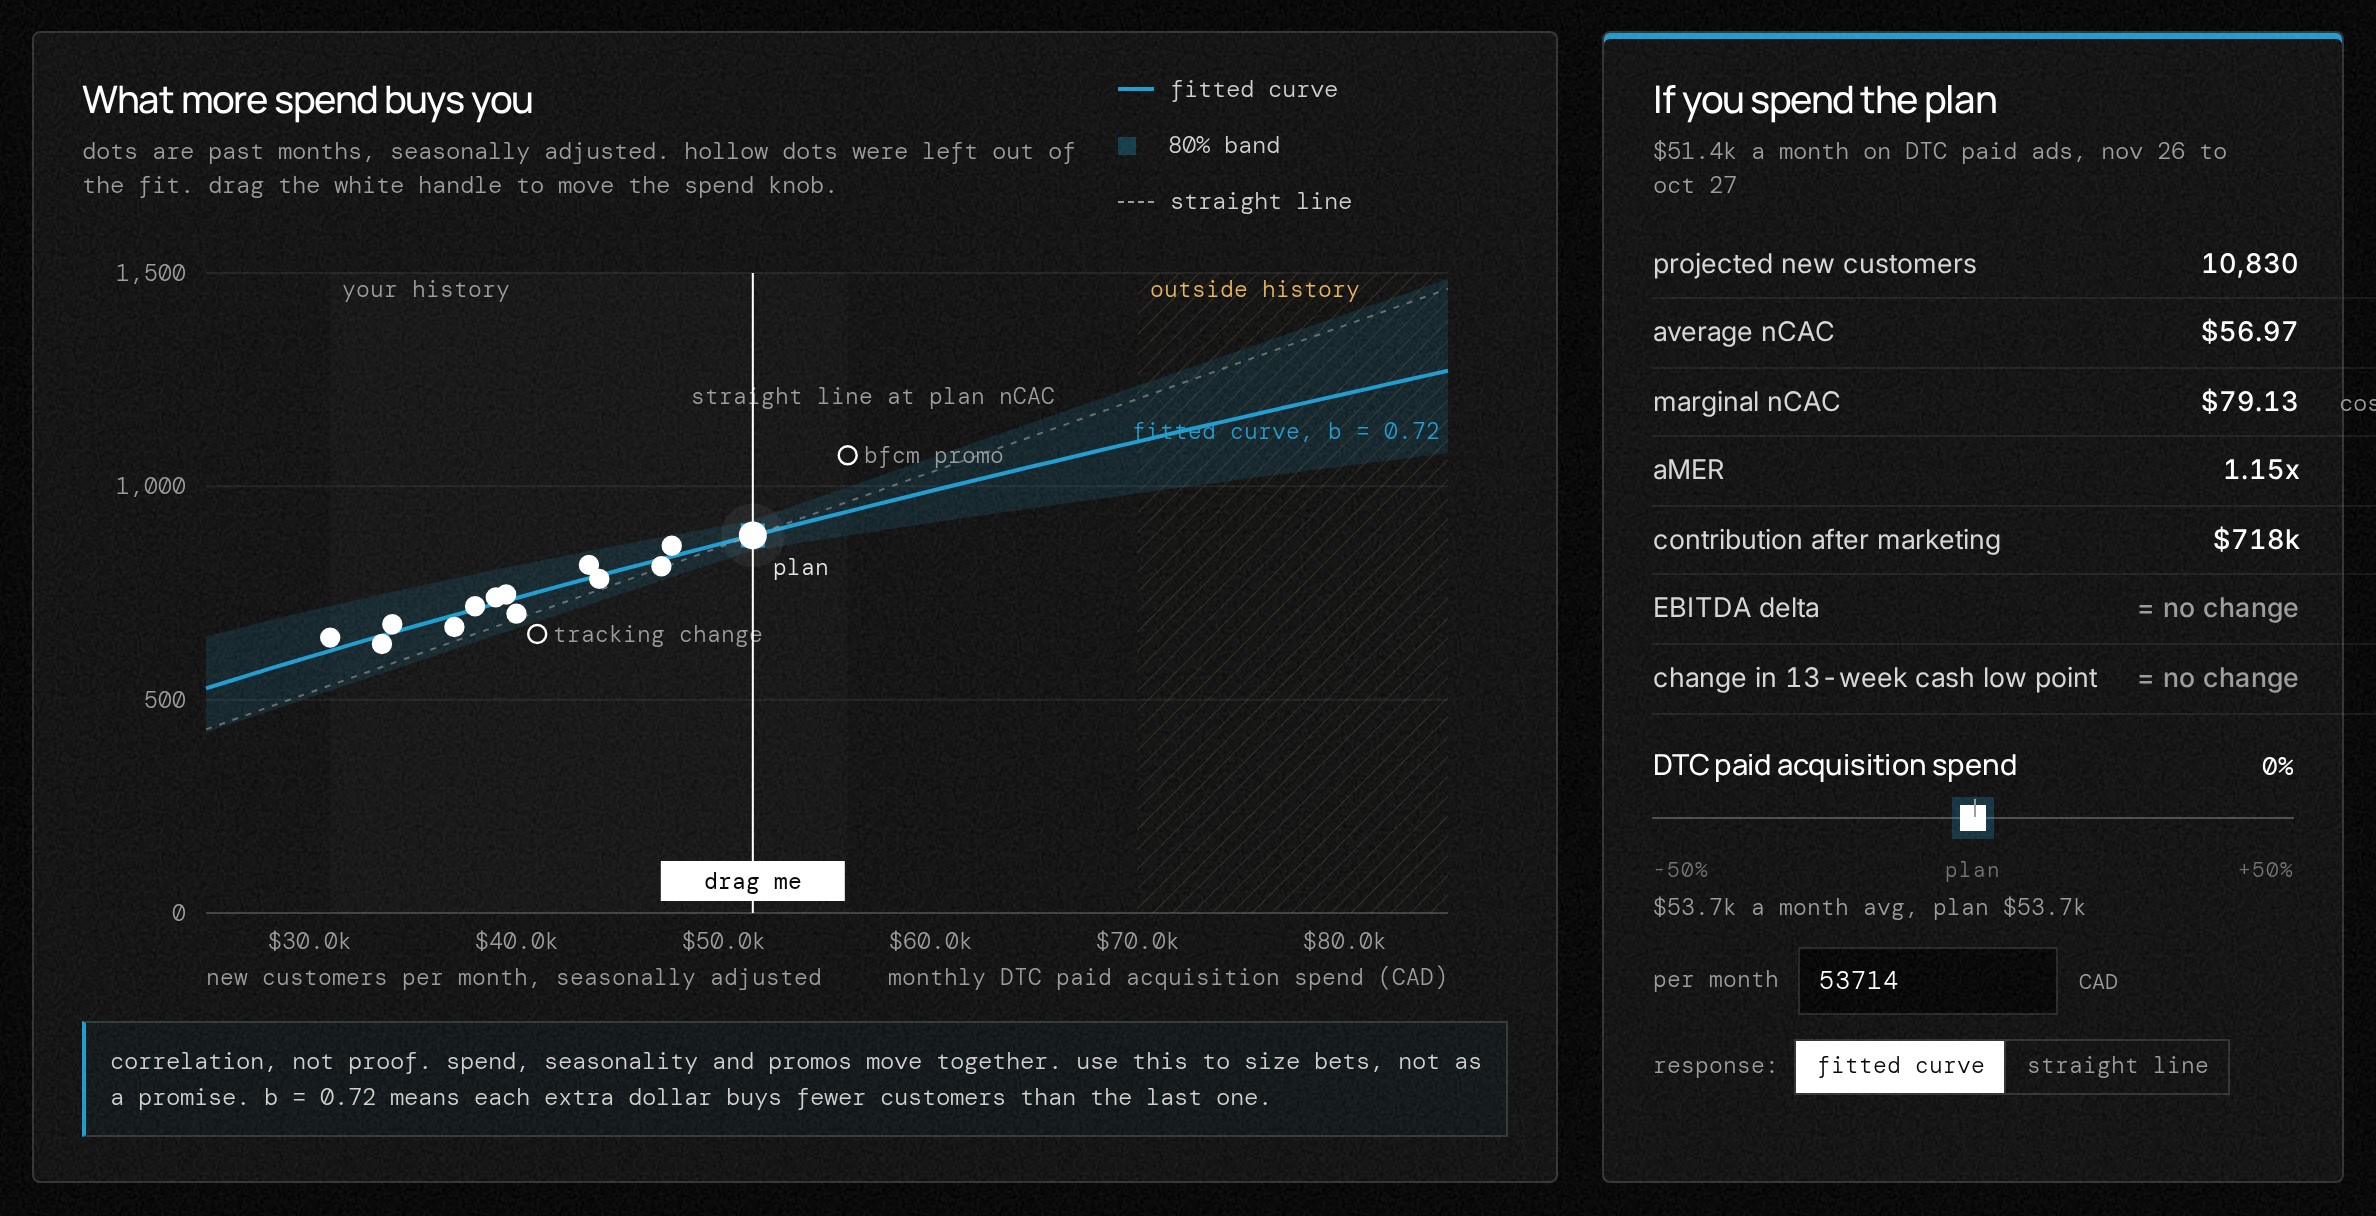
What more spend buys you.
Past months plotted as spend against new customers, with a fitted curve. The next dollar usually buys fewer customers than the last one. Move the plan and see projected new customers, marginal nCAC and the change to your cash low point.
Acquisition lab
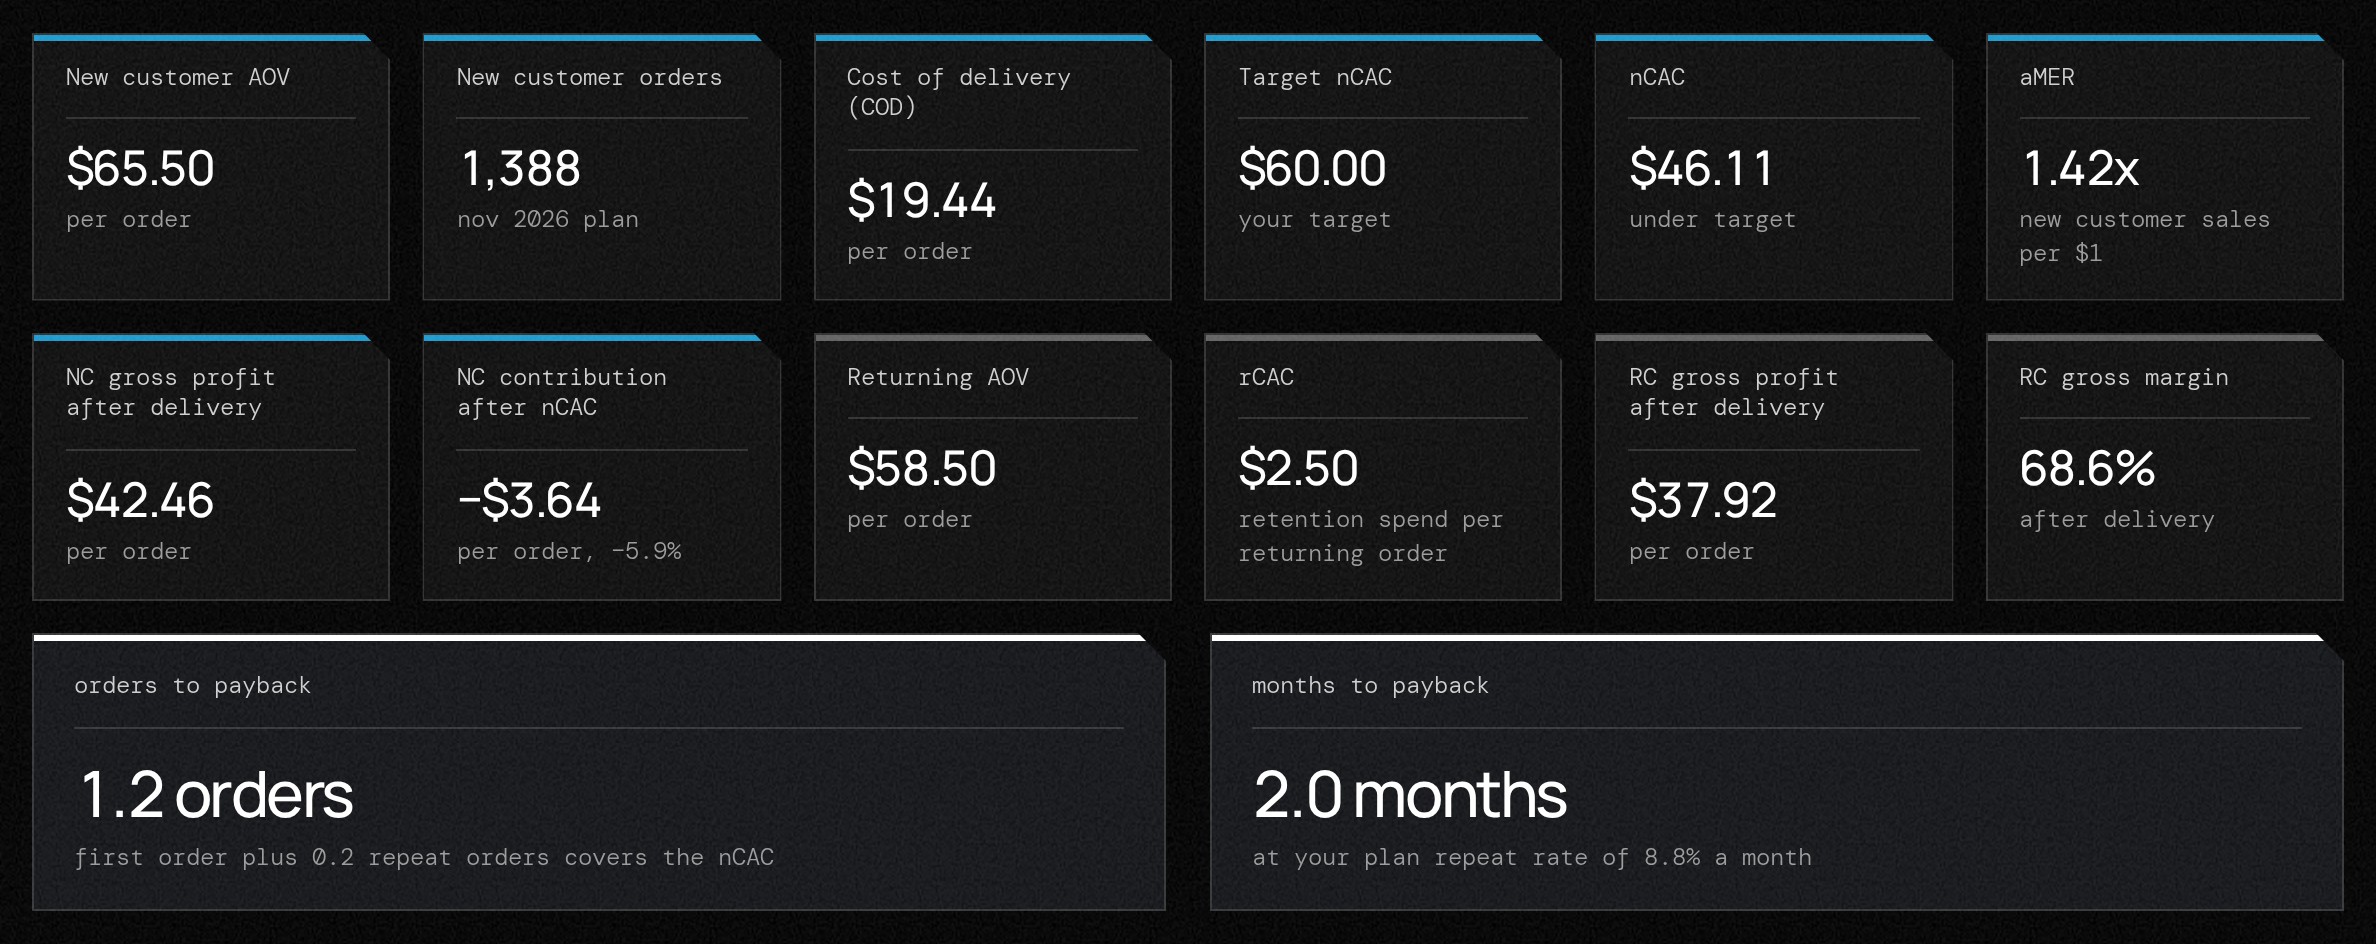
What a new customer really costs.
The nCAC calculator: new-customer order value, delivery cost, true nCAC, aMER and profit on the first order, plus how many orders and months it takes to earn nCAC back.
Unit economics
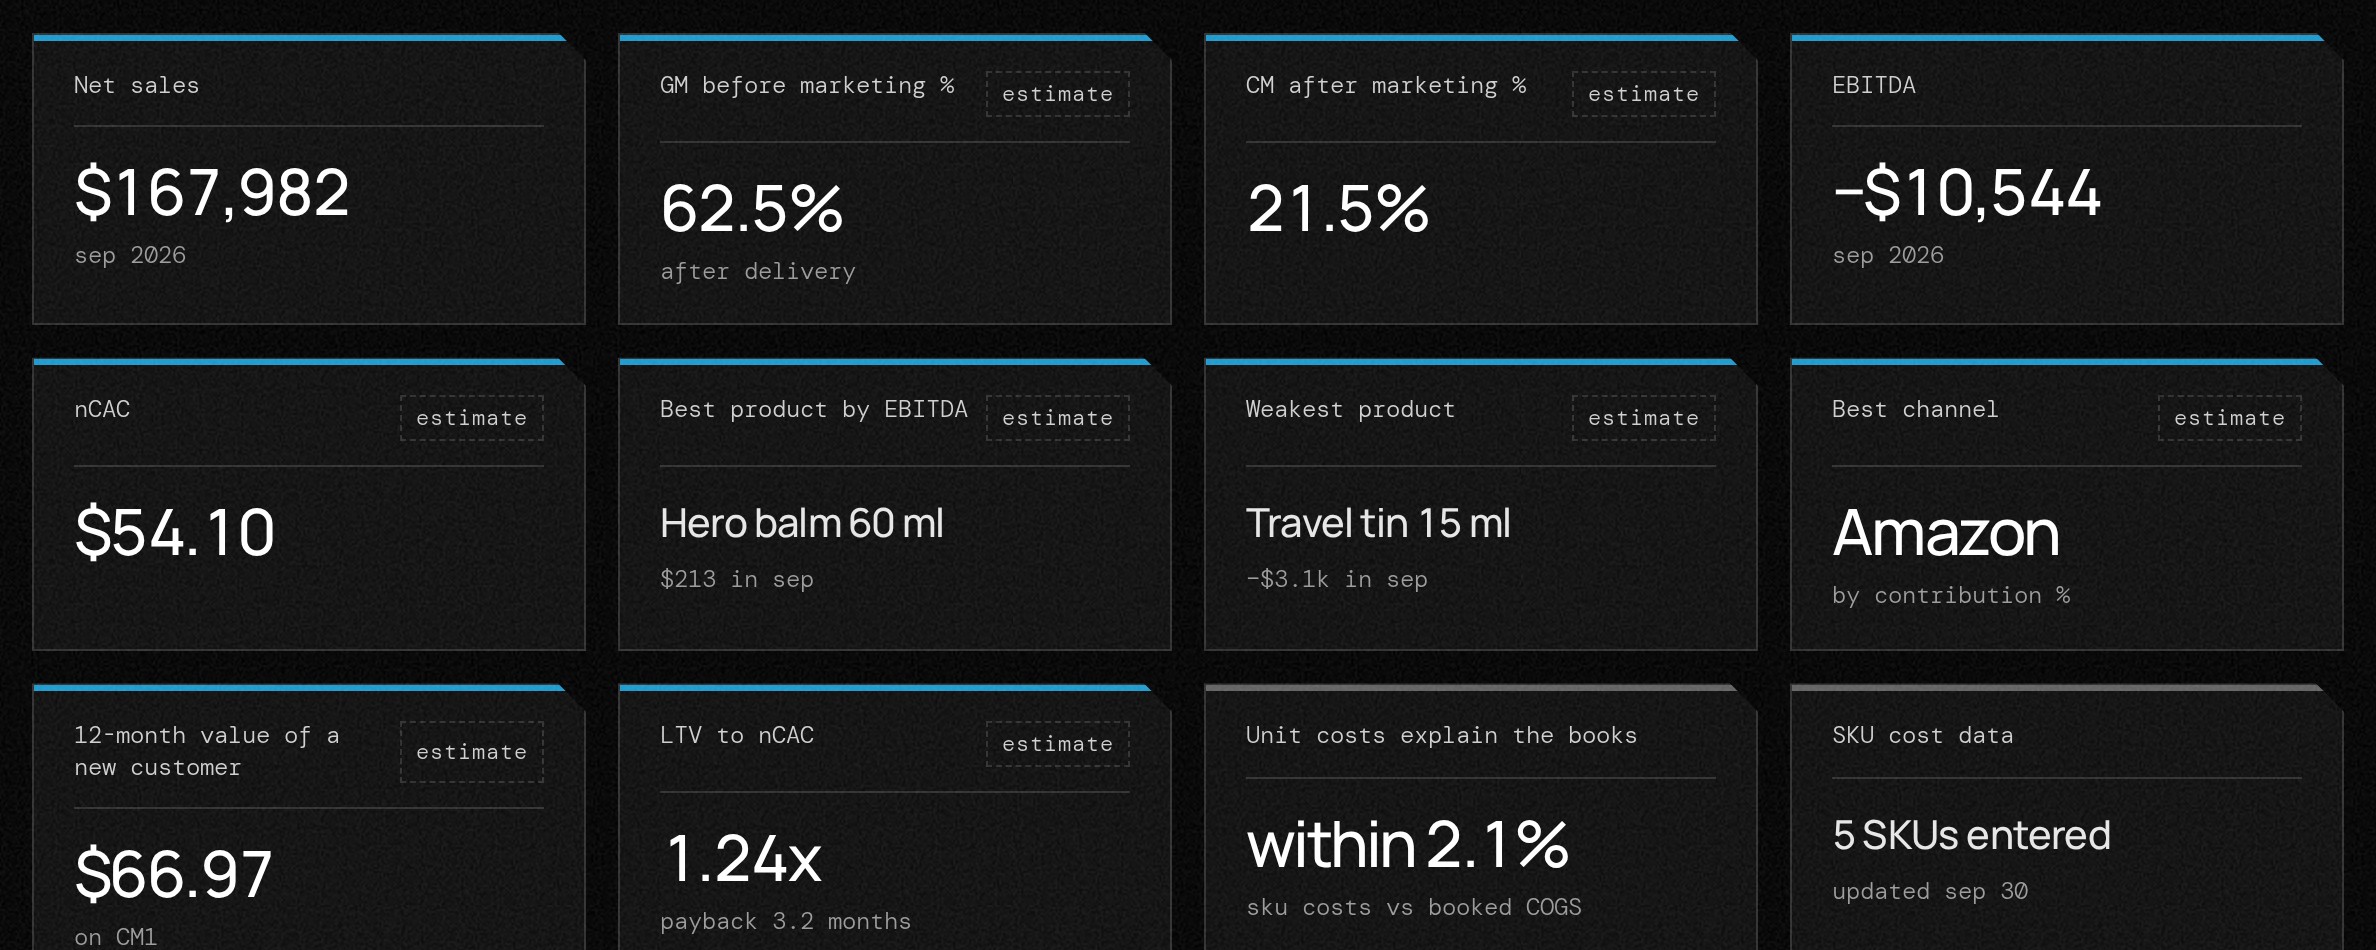
Which products and channels make money.
Net sales, margins and EBITDA for the month, nCAC, the best and weakest product, the best channel, and what a new customer is worth over twelve months. A big seller can still be thin.
Customers
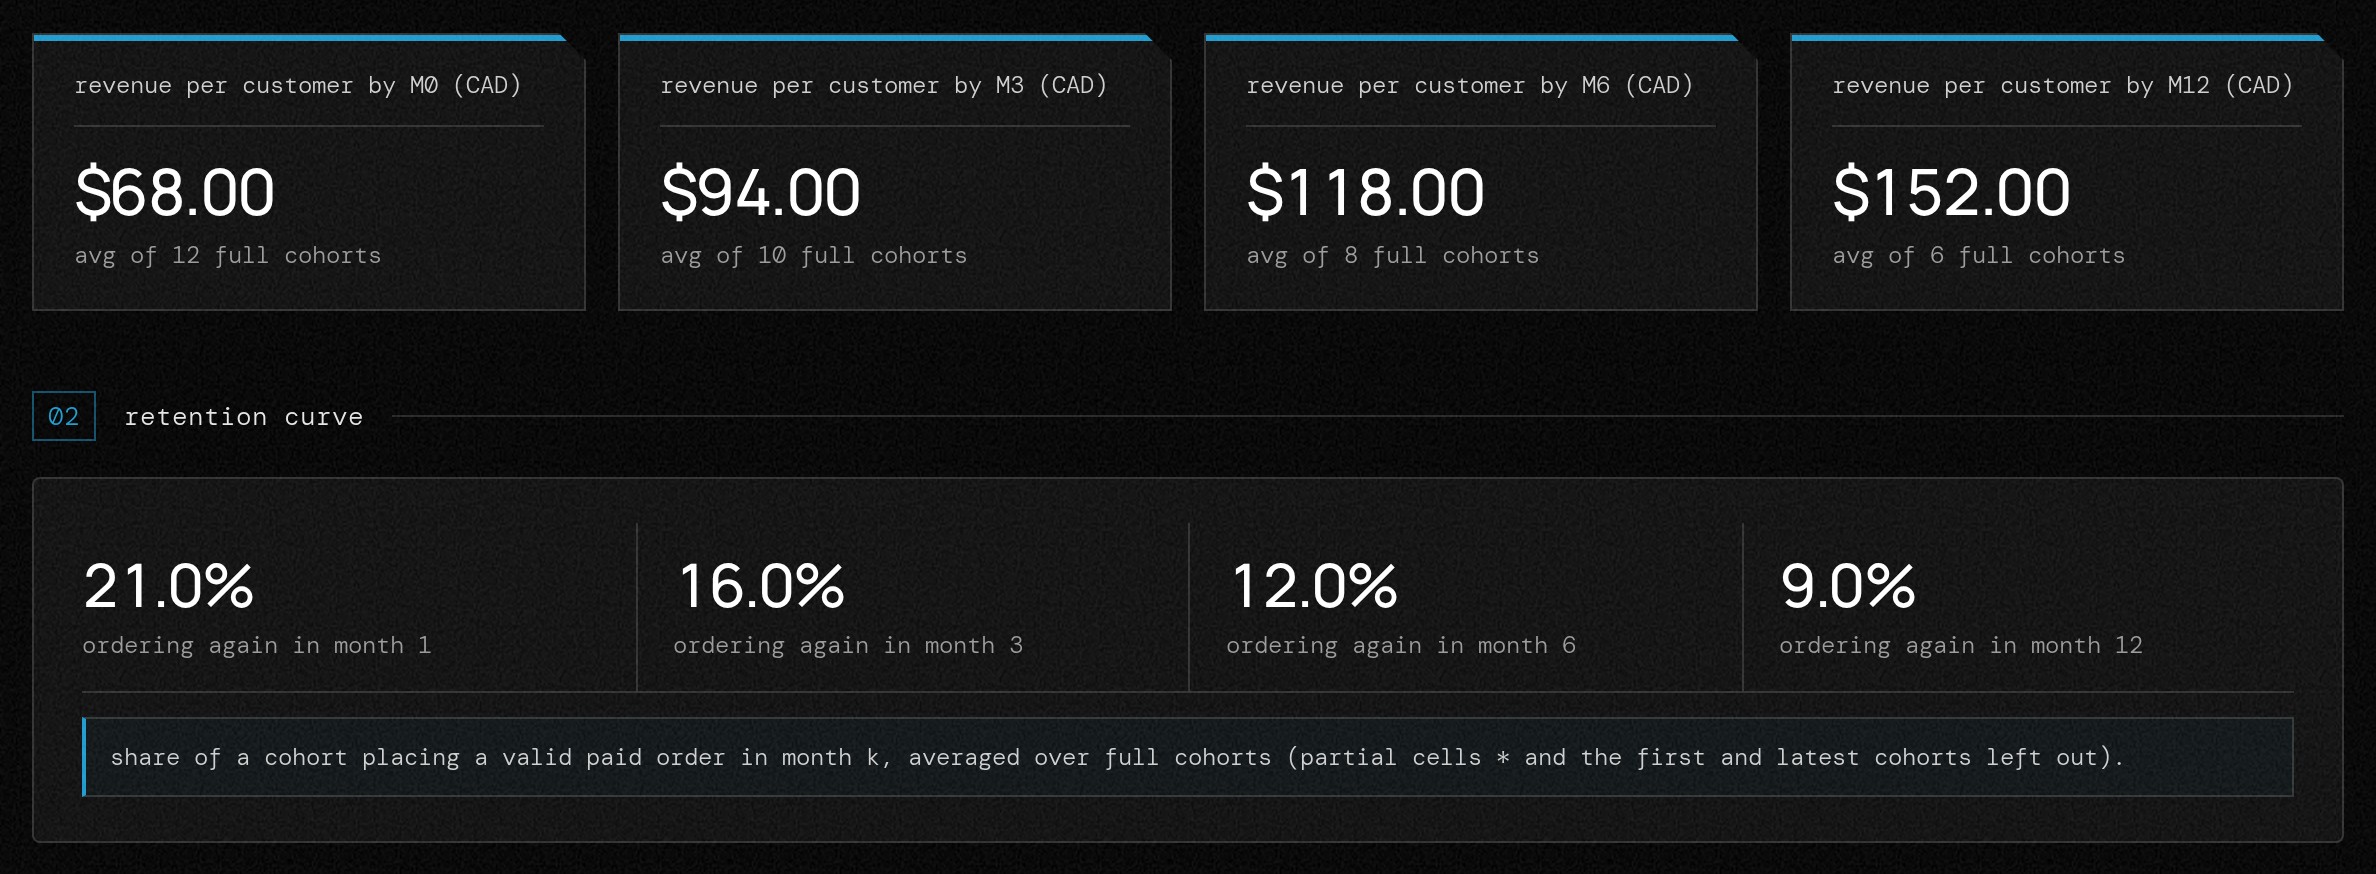
How each month of new customers comes back.
Revenue per customer at months 0, 3, 6 and 12, and the share of each cohort ordering again. Use it to set how high nCAC can go and still pay back, and whether to put money into retention first.
Actual vs forecast
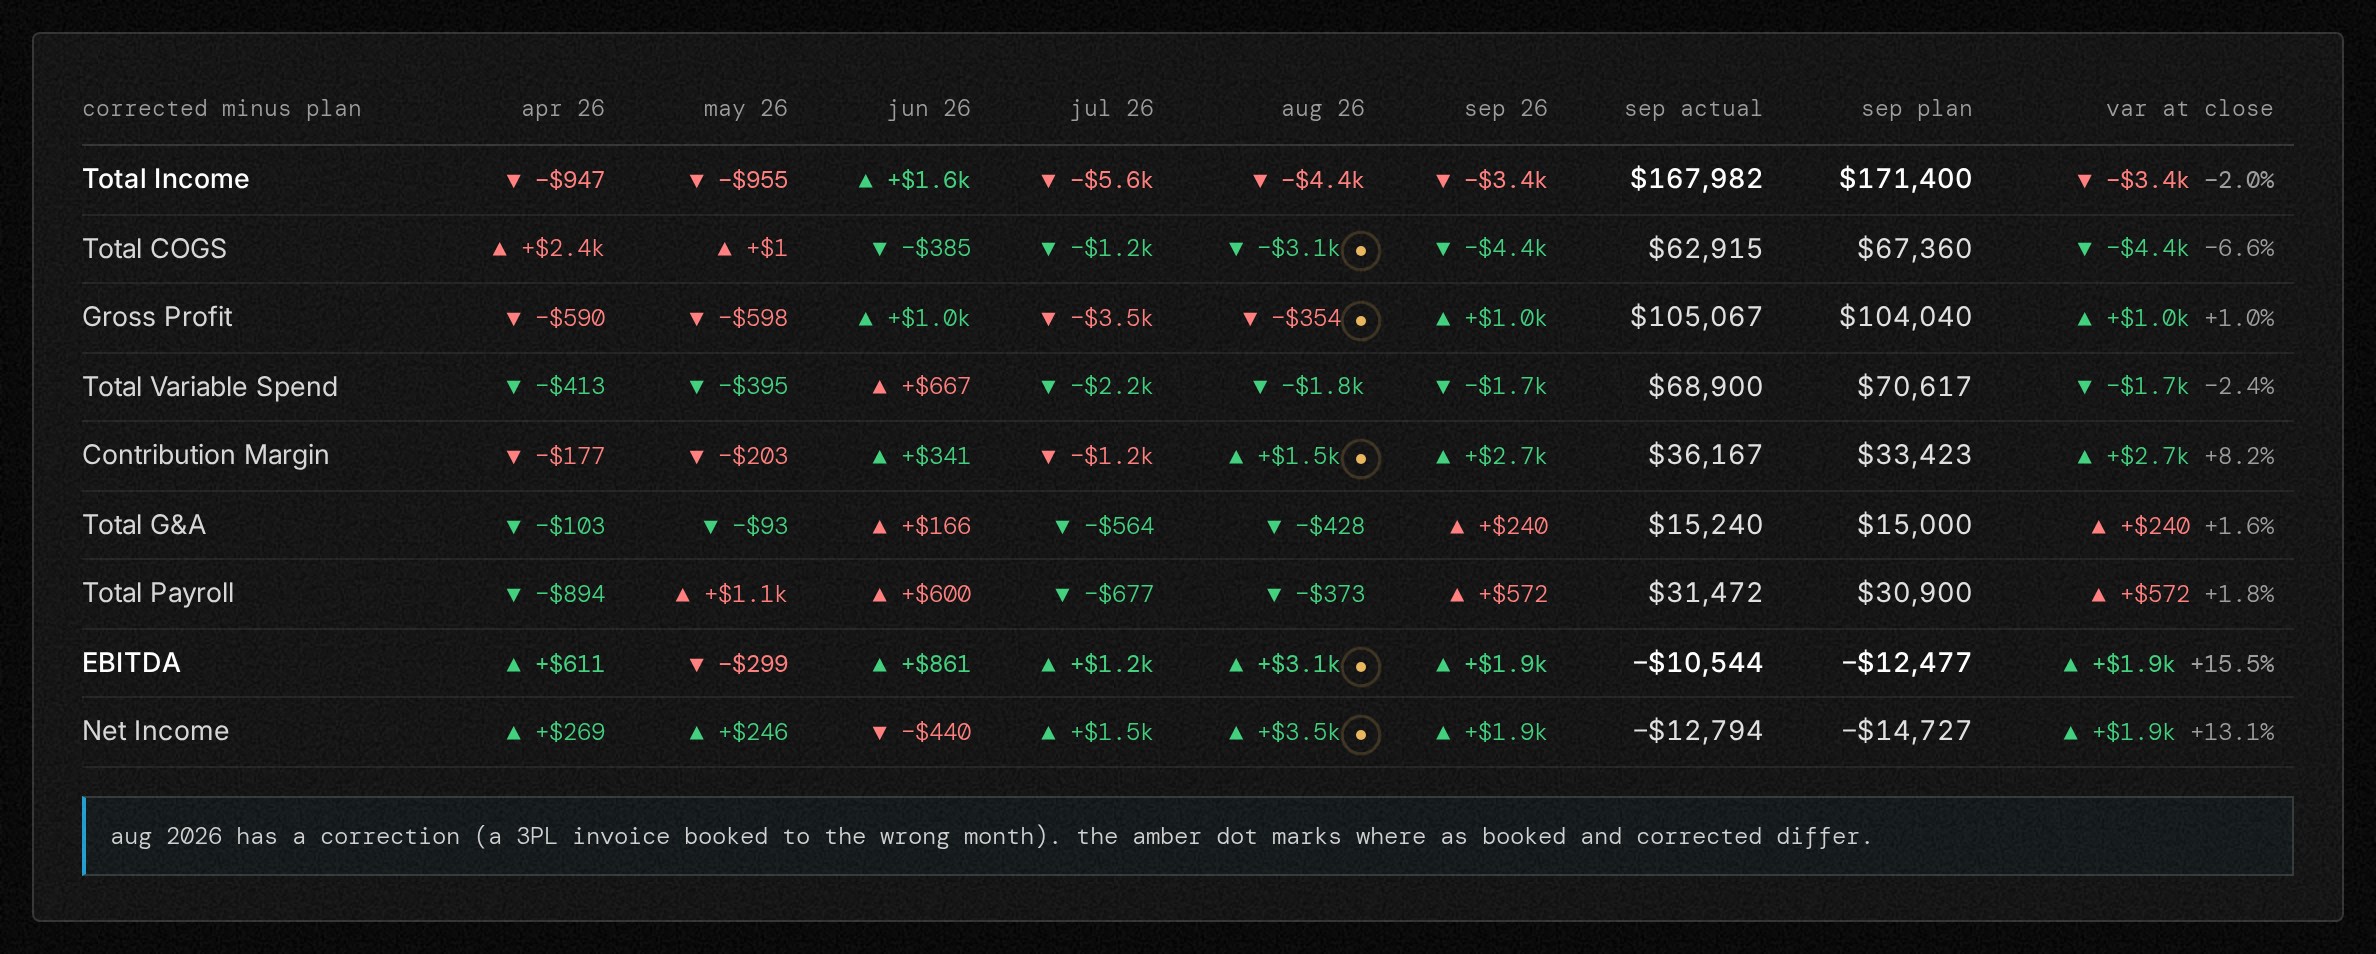
Did you hit plan.
For each closed month, actual minus plan for every P&L total, measured against the plan frozen on the 15th. Green is favorable, red is not. Use it to see what to fix now and what was a one-off.
Allocation
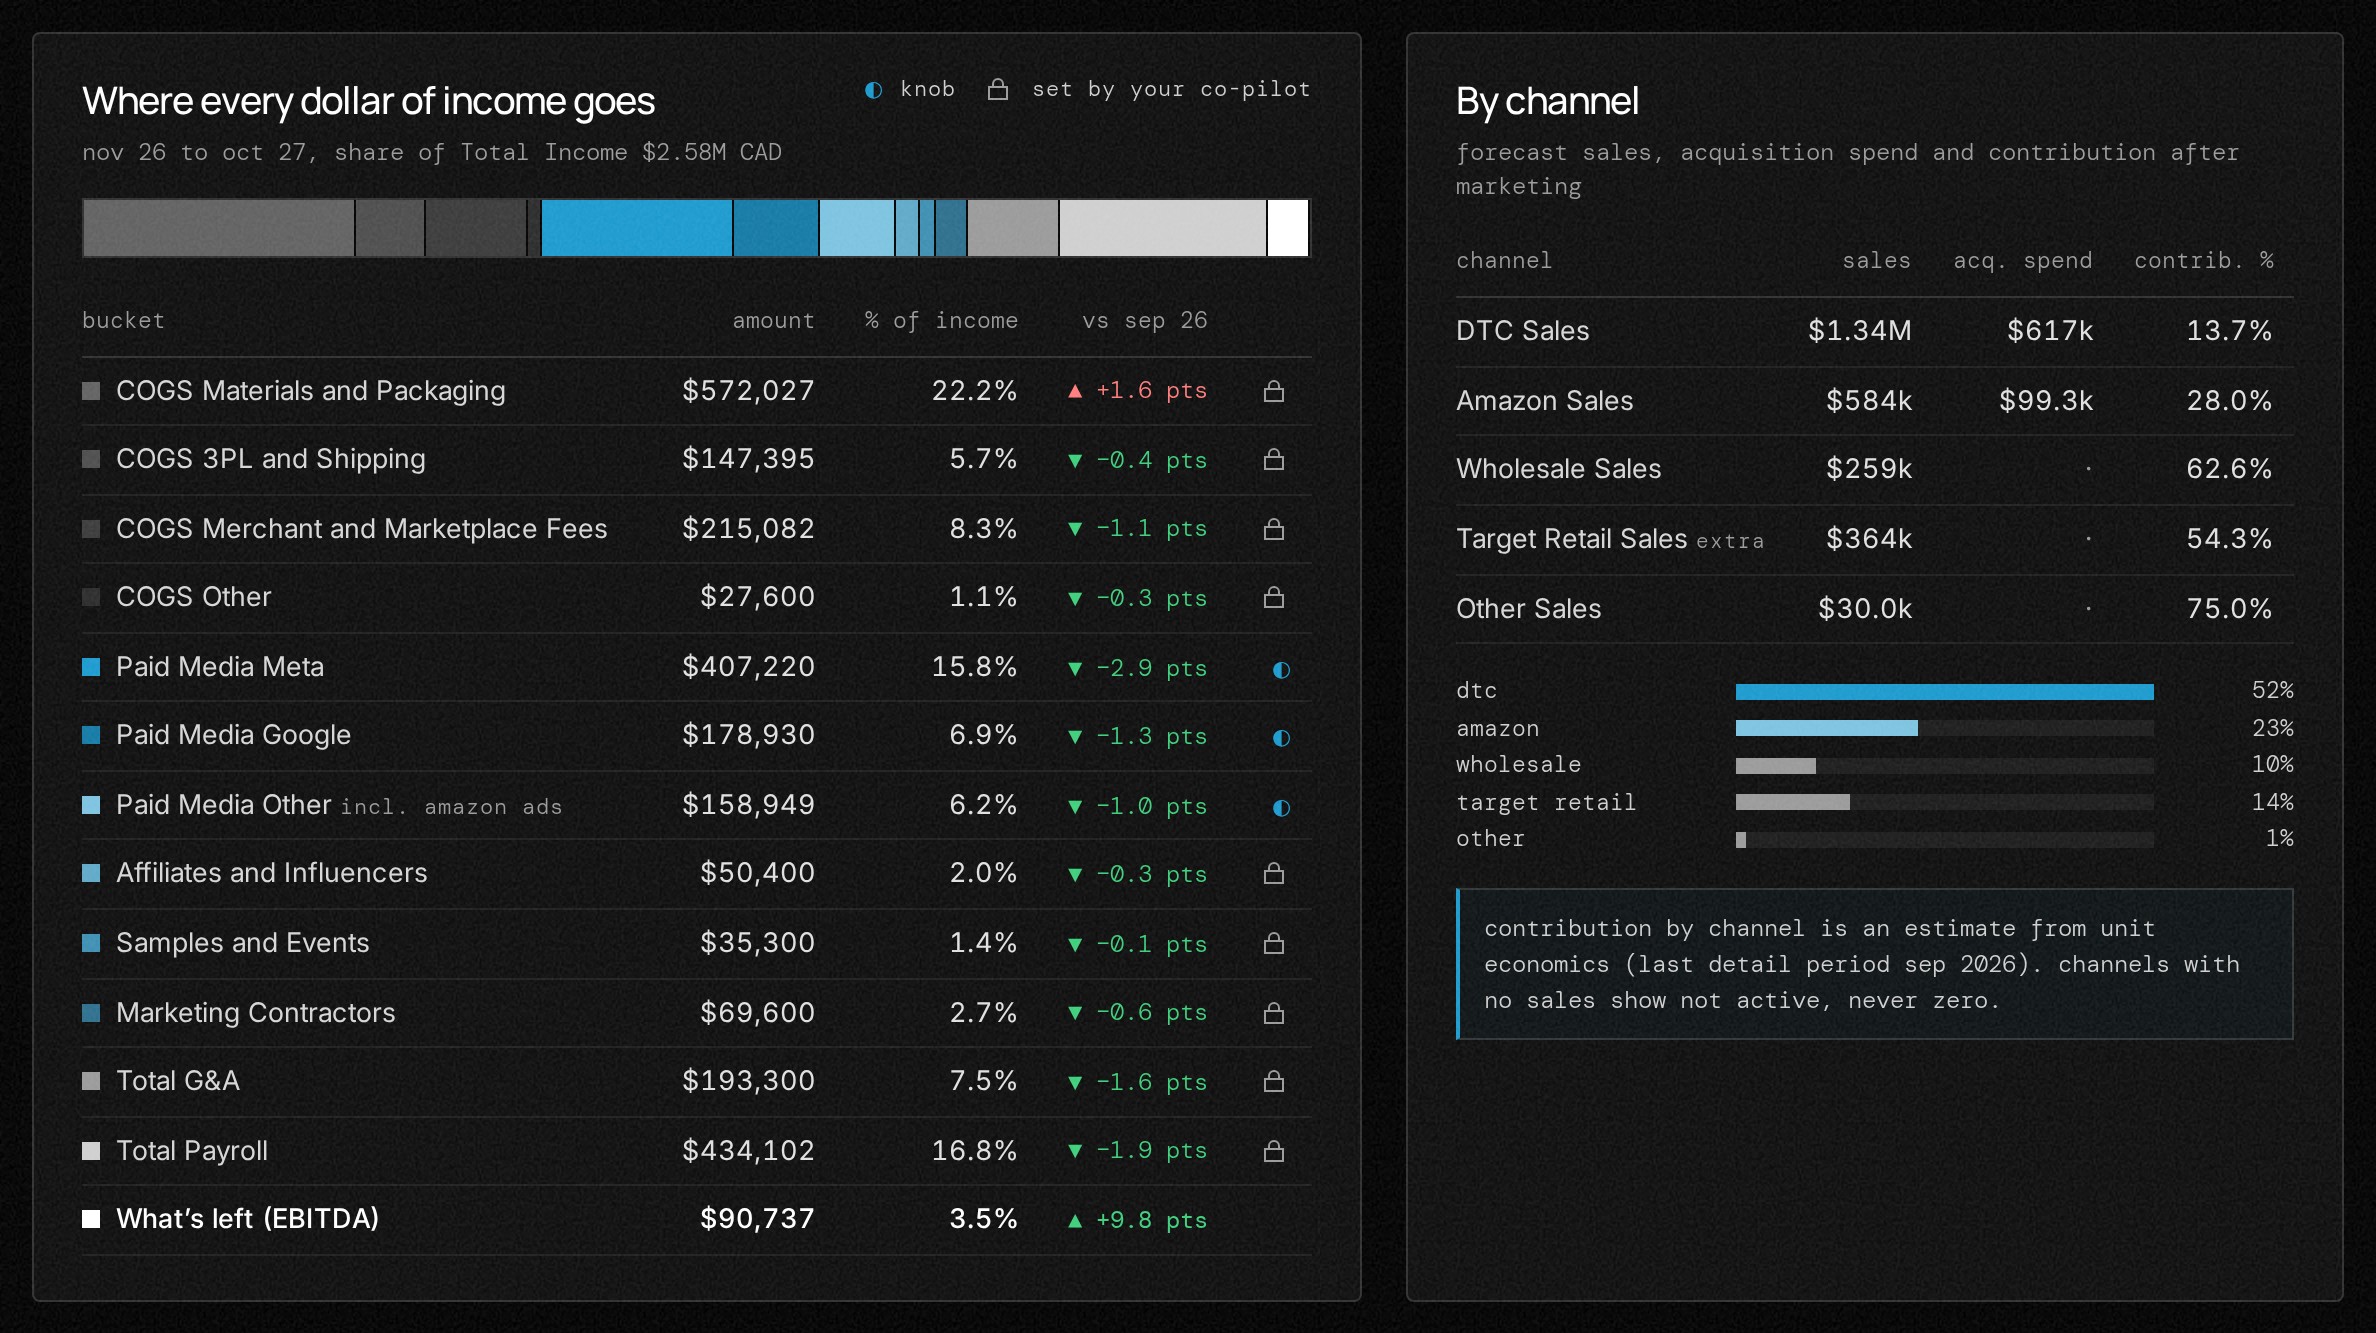
Where every dollar of income goes.
Every cost bucket as a share of income next to the last closed month, plus sales, acquisition spend and contribution by channel. Use it to spot the bucket that's creeping up.
How I think about your numbers
01
One source of truth
Every number comes from the app's own math on your source data. No competing versions in email, decks or side spreadsheets.
02
Real data over spreadsheets
Orders come straight from your sales channels and the books from your accounting software. Nobody re-types numbers into a sheet, so nothing drifts.
03
Forecast vs actual
Each month the plan is frozen. When the month closes, the actuals are compared to it, so I learn how good the forecast really is.
04
Decide with data
Every tab ends in a decision: how much to spend, when to buy inventory, when to hire. The numbers are there to act on.
True nCAC
nCAC is what it really costs to win one new customer. It's the number I steer acquisition by.
acquisition spend from your marketing channels ÷ new customers from your store = true nCAC
Each ad channel takes credit for the same customer, so their numbers add up to more customers than you really won. Counting each new customer once, from your store, and every acquisition dollar once, from the channels themselves, gives one honest number.
Counts in nCAC
- Paid media spend
- Creator and affiliate commissions
- Product seeding (free product sent to creators)
- Paid partnerships and sponsorships
Kept out of nCAC
- Events and agency retainers, which are fixed costs
- Non-media items in ad accounts (software, photo shoots, old bills)
The connectors
These are the platforms the Growth Engine can be set up to read for a client. Every setup starts with Shopify and QuickBooks Online, then I connect the channels you actually use.
core
The books and the store
Every setup starts here.
- Shopify
- QuickBooks Online
ad channels
Paid media
Spend by campaign, from each ad account.
- Meta Ads
- Google Ads (incl. YouTube)
- TikTok Ads
- Shop Campaigns (Shopify)
- AppLovin Ads
- Amazon Ads
- Pinterest Ads
- Snapchat Ads
- Reddit Ads
- X Ads
- Microsoft Advertising
- LinkedIn Ads
- MNTN (connected TV)
creator and affiliate
Creators, affiliates and UGC
Commissions and creator spend, so they count in true nCAC.
- UpPromote
- Superfiliate
- Trybe
- Shopify Collabs
- Social Snowball
- GRIN
- Aspire
- Archive
- impact.com
- Refersion
- Awin (formerly ShareASale)
- TikTok Shop Affiliate
sales channels
Beyond your store
Orders by channel, next to your DTC numbers.
- Amazon Seller Central
- TikTok Shop
- Walmart Marketplace
- Faire
optional
Also useful
- Klaviyo
integrations
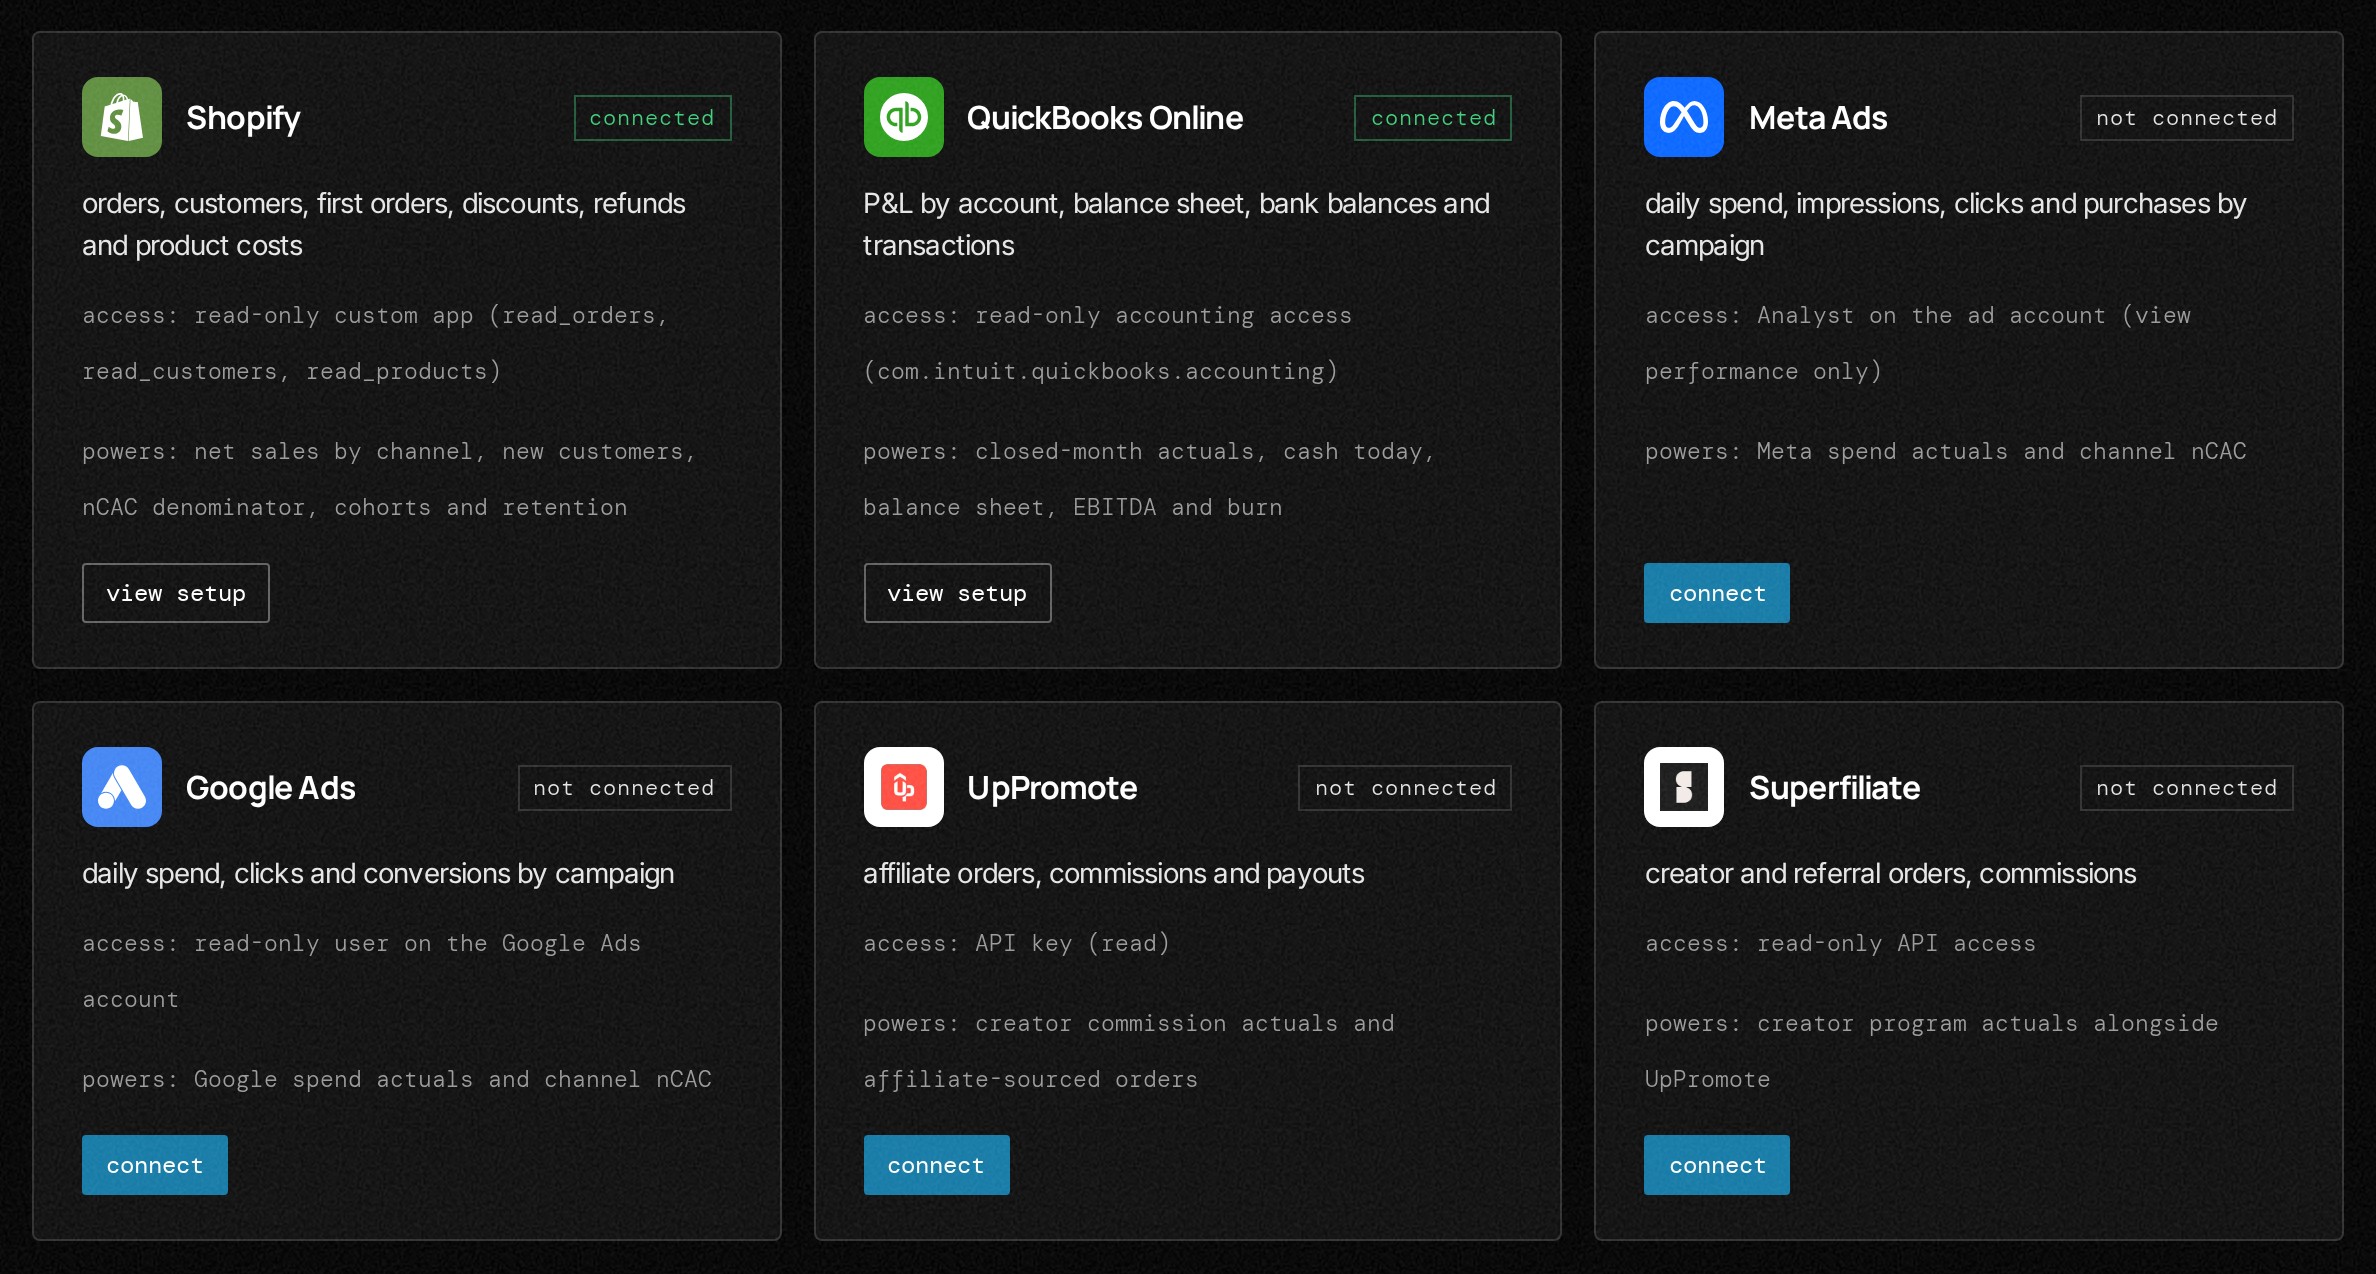
Every connection in one place.
The Integrations page shows each connection, what it reads, what it powers and whether it's connected.
Read-only, always
Every connection reads data. Nothing is ever posted, edited or deleted in your accounts. Spend no platform reports, like a paid partnership, is entered by hand each month.
Set up on one call
I connect everything together during onboarding. No passwords or keys go through email or chat. Using a platform that isn't listed? Ask on the call.
Who keeps it current
Your AI Co-Pilot. Every client has their own AI agent. It reads your latest actuals every day, runs checks (spend vs plan, new accounts in your books, nCAC drift) and updates the forecast when the data says it should. Every change is saved as a new version with one-click undo. It never touches a closed month, it only sees your company, and it never edits your books or ad accounts.
Me. I own the judgment and stay accountable for the numbers. I adjust the forecast when I know something the data doesn't yet, like a launch, a big PO or a channel test. My overrides always win over the model. When something material moves, you get a note from me in the dashboard.
free 30-minute call
Let's look at your numbers.
Bring the P&L and your ad accounts, or the spreadsheet nobody trusts. We'll look at where your nCAC, payback and cash actually are, and I'll tell you what I'd do next if I were in your seat. Plans start at $2500/mo, and the call is free either way.